

How Regulators Publish Inventory Data To Estimate Cannabis Days On Hand
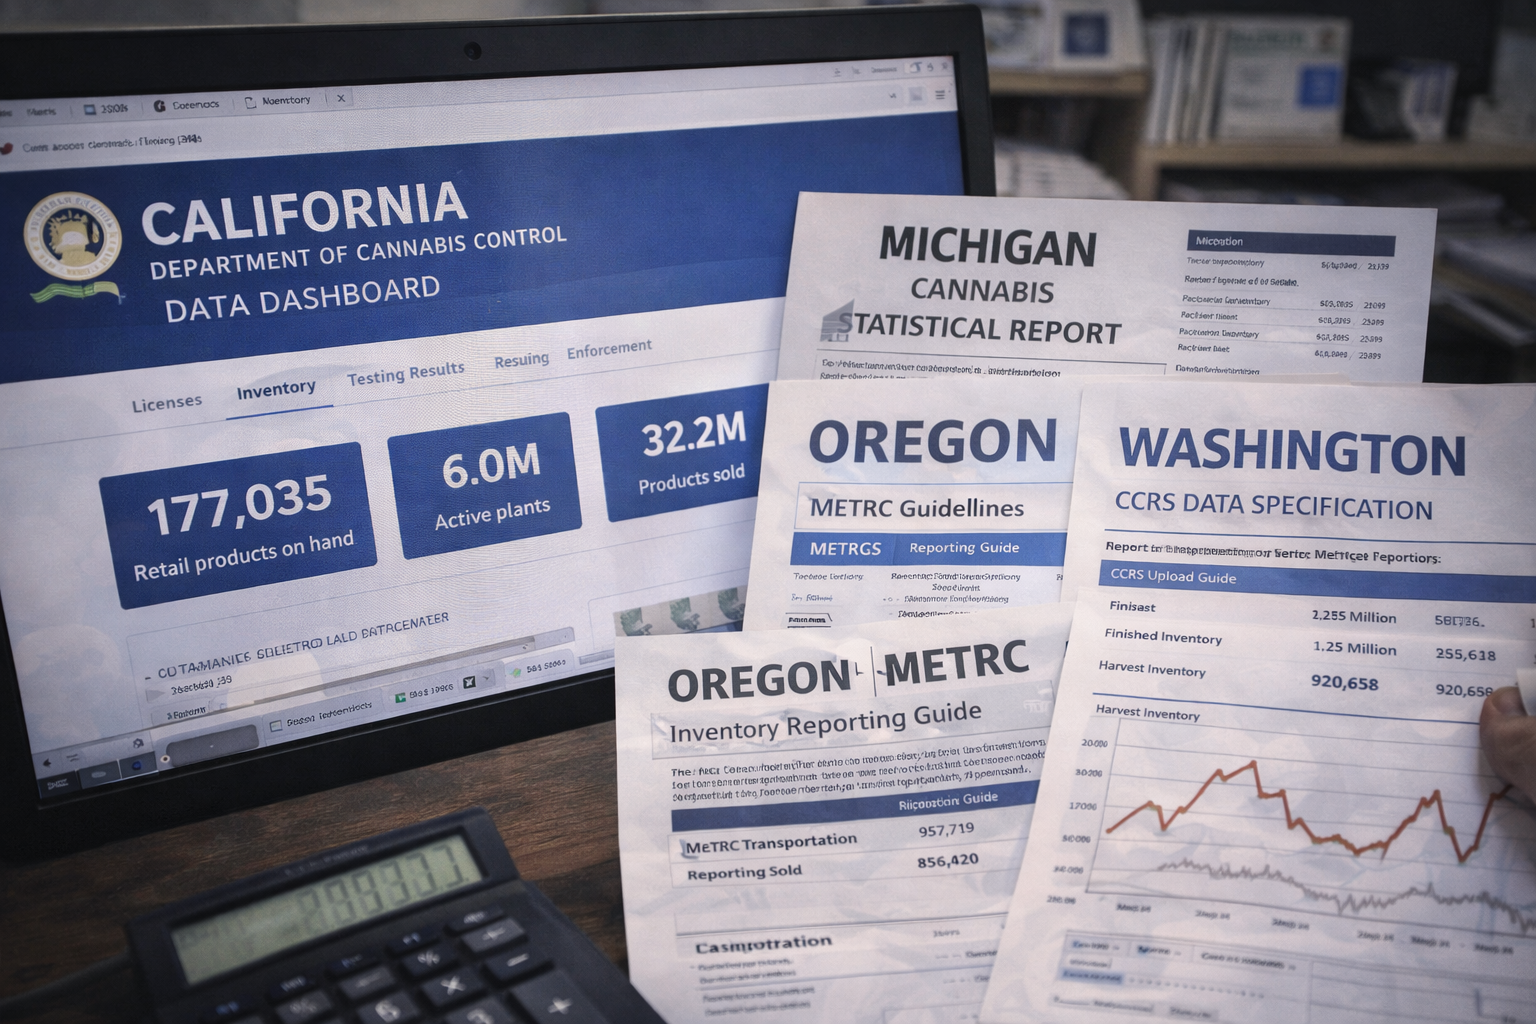
Multi state cannabis inventory reporting documents and dashboard used to estimate days on hand and supply pressure
Cannabis days on hand is one of the cleanest ways to spot supply pressure before it shows up as panic discounting. The problem is that most regulators do not publish a standardized days on hand metric. The good news is they already publish the building blocks you need to estimate it using inventory snapshots, package movement, and sales or transfer activity.
Quick facts
• California publishes statewide dashboards for licensing, harvest, and sales that can be used to benchmark supply versus demand signals
• Michigan publishes monthly statistical reports that include packages, inventory, transfers, and product sales data
• Oregon and Washington publish technical reporting guides for seed to sale style systems that show how packages, inventory, transfers, and sales are recorded and reconciled
• Operators, analysts, and insurers can use these public inputs to estimate inventory pressure even without an official days on hand dashboard
If you want to turn public regulator data into a simple days on hand view for your market, Start with our quick Cannashield intake form so you can map exposure and build a clean tracker.
What Days On Hand Means And Why It Beats Guessing
Days on hand is a simple idea: how many days your current inventory could cover at the current pace of sell through. The most common version is inventory divided by average daily sales. In cannabis, you can also calculate it using transfers or shipments when retail sales data is not available.
What makes days on hand powerful is that it converts chaos into one number you can watch over time. When days on hand climbs, supply is outrunning demand. When it drops fast, you have a stock risk or a demand spike. Either way, it is a planning tool, not a bragging point.
Universal operator lesson: revenue can look flat while risk climbs. Days on hand catches the pressure earlier than monthly revenue alone.
Where The Data Lives And What Each State Teaches You
California
California’s Department of Cannabis Control publishes data dashboards built from licensing and track and trace systems, including dashboards that focus on harvest activity and sales. You may not get a perfect inventory on hand figure from a public dashboard alone, but you can still build strong directional signals by comparing harvest volume trends to sales trends and watching how pricing shifts as supply expands.
Universal operator lesson: when harvest stays high and sales soften, compression is coming even if units look stable.
Michigan
Michigan publishes monthly statistical reports that include packages and inventory snapshots plus transfers and product sales. This is the closest thing to a regulator published days on hand starter kit because it gives you inventory amounts and movement in the same monthly package. With this structure, you can estimate days on hand by category using a simple method: take the reported inventory snapshot for a category and divide it by the average daily sales or average daily shipped amounts for the period.
Universal operator lesson: when inventory at processors and growers stays high while sales slow, wholesale price pressure usually follows.
Oregon
Oregon’s regulator provides guidance on how inventory and transfers are recorded in the cannabis tracking system, including daily reconciliation expectations. That matters because days on hand is only as good as the underlying reporting discipline. If inventory is not reconciled daily and transfers are not recorded timely, your days on hand estimate turns into a story, not a metric.
Universal operator lesson: data quality is a competitive advantage. The operator who reconciles cleanly can plan cleanly.
Washington
Washington’s reporting system documentation is highly structured. CCRS resources include data model and upload specifications that cover inventory records, inventory adjustments, inventory transfers, and sales files. That means you can build days on hand style insights if you can pull a consistent inventory snapshot and a consistent movement measure. Washington also highlights the real world truth of modern compliance reporting: data is built through defined fields, templates, and required uploads, not through vibes.
Universal operator lesson: when reporting is structured, the winners are the teams that can operationalize data quickly, not the teams that simply collect it.
If you want a plug and play days on hand worksheet and a simple method to pick the right movement denominator for your state, Complete our Cannashield questionnaire and request the template.
A Simple DOH Method Using Public Data
Here is a practical approach you can use across states without waiting for a regulator to publish days on hand.
Step 1. Pick your scope
Choose one state and one product bucket. Flower, vapes, edibles, or total packaged inventory. Consistency matters more than perfection.
Step 2. Find an inventory snapshot
Use the inventory amount published in a monthly report if available. If not, use a proxy such as harvest volume trends combined with sales trends to estimate whether supply is building.
Step 3. Pick a movement measure
If retail sales are available, use average daily sales. If only transfers or shipments are available, use average daily shipped amounts.
Step 4. Calculate and trend
Days on hand equals inventory divided by average daily movement. Track it monthly. A single month is noise. Three to six months is signal.
Step 5. Translate the number into decisions
High days on hand usually means discounting pressure, tighter buyer terms, and higher spoilage or obsolescence risk. Low days on hand can mean stockouts, missed demand, and rushed purchasing.
Step 6. Add a risk lens
As days on hand rises, losses become more expensive. This is when documentation, security, and quality controls matter most because one preventable incident can erase a month of margin in a compressed market.
If you want a risk focused inventory pressure snapshot for underwriting, lending, or expansion planning, use the Cannashield intake form and we will send a checklist for building a defensible days on hand view from public data.
Conclusion
Regulators may not publish a standardized days on hand dashboard, but they already publish the raw building blocks that let you estimate supply pressure. California gives statewide harvest and sales trend visibility. Michigan provides monthly packages, inventory, transfers, and sales. Oregon and Washington publish the reporting logic that shows how inventory and movement get recorded. Use these signals to plan earlier, protect cash flow, and avoid getting trapped when the market shifts.
What To Do This Week
• Pick one state and one category and define your days on hand denominator, sales or transfers
• Pull the latest public inventory snapshot you can find and write down the number in a simple tracker
• Calculate a three month average daily movement rate and compute days on hand
• Set a trigger threshold for action, like a 20 percent rise in days on hand over two months
• Tighten documentation storage for invoices, COAs, and transfers so you can validate your own numbers quickly
• Add a monthly calendar reminder to refresh the tracker and review trend direction
FAQ
What is cannabis days on hand
It is an estimate of how many days current inventory could cover at the current pace of sell through or transfers.Why do regulators not publish days on hand directly
Many regulators publish raw data and dashboards, but do not standardize a single days on hand metric across all license types and product categories.What is the best movement measure to use
Use retail sales if you have it. If not, use transfers or shipped amounts as a proxy for movement.Can days on hand be estimated from public data
Yes, as a directional metric. It is best used for trend tracking, not perfect precision.Why does days on hand matter for risk planning
High days on hand usually means margin pressure, higher inventory risk, and stronger incentives for shortcuts. That raises operational risk.What is the universal operator lesson across states
Markets punish slow planning. A simple days on hand trend beats guessing and helps you protect cash and discipline.